Based on analytical reports and anecdotal evidence, the protracted seller’s market in M&A has shown no signs of receding. Like many deal professionals, we believe that key deal terms are a lagging indicator in a seller’s upmarket and a leading indicator in a down one, and therefore will show the effects of a contraction before they are reflected in valuations.
Our semi-annual Key Deal Terms Report is catching the “top” of the market and is further able to capture and segregate the impact of representations & warranties (rep & warranty) insurance, a product that has gained sweeping prevalence over the past two years.
With the release of GF Data’s Fall 2017 Key Deal Terms Report, which covered transactions completed in the $10 million to $250 million value range at multiples of 3-15x trailing twelve months Adjusted EBITDA through June 30, 2017, here is what we are seeing:
Valuations appear to have topped out
Average valuations in the GF Data universe rose steadily from 6.3x in 2012 to 6.9x in 2017. Pricing has remained at that level in the first six months of this year. Notwithstanding the impression in some circles that every private equity-backed transaction large enough to command interest from lenders is trading at 11 to 13 times adjusted EBITDA, the average mark at $50 million to $250 million total enterprise value (TEV) is 8.2x in the year to date, about in line with last year.
There’s simply no evidence in the data of either continued upward movement or of the retrenchment that many deal professionals and analysts expected by now.
While valuations have plateaued, key seller deal terms have continued to improve
General caps on indemnification against breaches of reps & warranties remains the most prominent “deal point,” 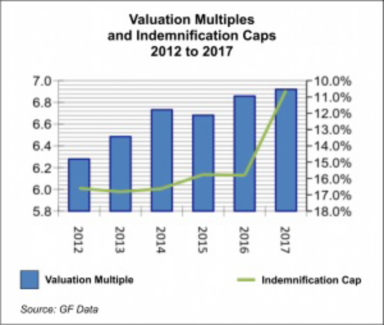 and therefore the most prominent benchmark on the state of play between sellers and buyers once headline economic terms have been set.Caps averaged close to 17% of TEV during the period from 2012 to 2014, then ticked down to about 16% in 2015 and 2016. In the year to date, that number has declined further to 10.6%. The chart shows the interplay between valuation multiples and caps. (The right-hand axis depicting indemnification caps is inverted to display them from the sellers’ perspective.)
The analysis is complicated by the dramatic increase in utilization of rep & warranty insurance over the past year.
In 2016, buyers reported that an insurance product was utilized on 7.5% of the transactions completed. In the year to date, that figure soared to 34%. On larger middle market transactions, the jump was most pronounced. In the $50 million to $250 million TEV range, the incidence of rep & warranty insurance rose from 11.8% in 2016 to 56.4% in the 2017 year to date.
Further, if one wants to make “apples to apples” comparisons, it is not so easy as to take the deals completed without insurance and line them up against those closed in earlier years. Not surprisingly, businesses able to satisfy underwriting standards and otherwise suited to the insurance product are as a group more highly valued than those that trade with no insurance.
In 2016 and 2017, the differential was precisely the same. The overall mark of 6.9x parsed out into 7.2x for deals with insurance, 6.7x for those without.
Once the noise of insurance is eliminated, caps have been continuing to decline across the board.
For deals with insurance, the decline from 2016 through the first half on 2017 was about seven percentage points, from about 20% to 13%. For deals utilizing insurance, the drop was four percentage points, from about 7% to 3%. Among deals with insurance, the drop was most pronounced in the $25 million to $50 million TEV bracket – about 4.5%.
Our experience tells us that provisions like indemnification cap and escrow/holdback amounts continue to have momentum even after valuations have flattened. Then, when the market turns, buyers find it easier to tighten up on these provisions before compelling would-be sellers to accept reductions in economics.
It follows, then, that these are the numbers likely to provide an early view of whether the rollercoaster that has been enjoying a leisurely glide path at long last starts to crest.
About the Author
 Andy Greenberg is CEO of GF Data®, based in suburban Philadelphia, and Senior Advisor of TM Capital, a mergers & acquisitions advisory firm with offices in New York, Atlanta and Boston. GF Data is the leading providing of valuation, volume, leverage and key deal term information on private transactions in the $10 million to $250 million value range. All charts and data subject to the GF Data terms of use.
For information on subscribing or on contributing data as a private equity participant, please contact Bob Wegbreit at bw@gfdata.com or at 610-616-4607.