GF Data’s recently released year-end report (Easy A’s and Killer B’s) theorized that a value environment remaining steady at unprecedentedly high levels is actually more complex than the surface suggests – that there are competing cross-currents beneath the unchanging water line. We thought it would be interesting to see how this theory holds up.
Deal multiples averaged 7.2x Trailing Twelve Months (TTM) Adjusted EBTDA for all of 2018, essentially in line with 7.3x in the prior year.
Completed deal activity in the fourth quarter of 2018 showed there is plenty of pop remaining in this extended seller’s market – the average mark for the fourth quarter was 7.8x. However, this followed our observation in the third quarter that some sectors appeared to show signs of “a bit of a soft landing” in multiples.
As we noted in the year-end report: “The full-year data suggests that both dynamics may be at work at the same time — that valuations on “A” properties in “B” segments of the market may have eased, while “B” properties in “A” segments continue to find new headroom.”
The GF Data universe comprises 200 private equity firms and other sponsors reporting on deals they complete in the $10 million to $250 million total enterprise value (TEV) range, at valuation multiples of 3-15x. Each deal is tagged with a business category grouping and a six-digit NAICS industry code. This enables us to plumb the depths of industry sectors and sub-sectors. (1)
Here are five cases drawn from the data:
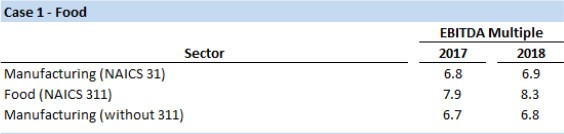
Case 1 – Food Manufacturing
Manufacturing is the largest business category in our universe. Valuations were virtually unchanged from 2017 to 2018 – averaging 6.8x and 6.9x, respectively. These numbers are considerably ahead of the 6.1x average for the 16-year life of the data set.
Food Manufacturing (NAICS 311) is consistently one of the most highly valued groupings within Manufacturing. In that category, average pricing improved from an already-lofty 7.9x in 2017 to 8.3x in 2018. Through the miracle of mathematics, remove food from the broader category and aggregate multiples in manufacturing are slightly reduced.
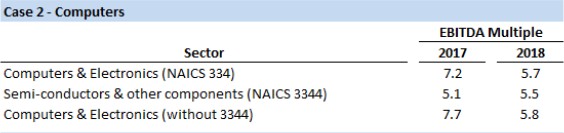
Case 2 – Electronics Equipment and Components
NAICS 334 is the grouping that encompasses computers and electronics equipment, as well as components. Amid streakier consumer demand and uncertainty over tariffs, the grouping as a whole fell off the table in 2018 – an average valuation of 5.7x compared to 7.2x in the year prior. However, the components sub-grouping (NAICS 3344), while more lightly valued than the end-use products, showed more staying power, with a 5.1x mark in 2017 perking up to 5.5x last year. Remove components, and the fall off in the broader category was actually even more pronounced.
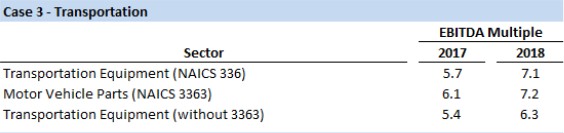
Case 3 – Transportation Equipment
Transportation Equipment Manufacturing (NAICS 336) had a strong year-over-year gain, rising from 5.7x in 2017 to 7.1x in 2018. However, this is also a grouping in which it is useful to separate out components from OEM product offerings. Motor Vehicle Parts (NAICS 3363) recorded an increase of a full turn – from 6.1x to 7.2x – over these two years. This is consistent with comparable public stock trading performance. When 3363 is backed out of the broader category, we see a similar rise, though at lower multiple levels. This data suggests the extent to which financial acquirers are gravitating to the defensive qualities of the automotive parts aftermarket.
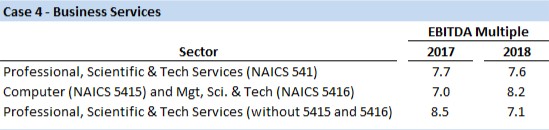
Case 4 – Business Services
NAICS 541 shows a sharp cleavage between technical and other professional services. The grouping as a whole experienced little change in valuation, edging down from 7.7x to 7.6x. However, two technically oriented two subgroupings – NAICS 5415 (Computer Systems Design and Related Services) and 5416 (Management, Scientific and Technical Consulting) powered upward. Valuations in these subgroupings, taken together, jumped from 7.0x to 8.2x. The balance of 541 comprises various professional services (e.g., legal, accounting, advertising) – and in that cohort, multiples fell markedly.
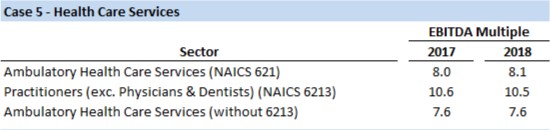
Case 5 – Health Care Services
NAICS 621 is the grouping that encompasses most outpatient health care services. Average pricing held steady at elevated levels year over year – 8.0x in 2017 and 8.1x in 2018. However, in both years this grouping was held aloft by singular strength in NAICS 6213 – Health Care Practitioners (excluding Physicians and Dentists). This group includes veterinary practices and non-physician medical practice areas continuing to experience intense consolidation interest. The 6213 grouping traded at an average of 10.6x in 2017 and 10.5x in 2018. If we remove this sub-grouping, valuations on the balance of health care service deals remain flat but at half a turn less than the aggregate.
It seems clear that the private M&A market is becoming increasingly mindful of intermediate term economic scenarios, alongside longer-term business and demographic trends. We will continue to look for the fault lines in our data.
Footnotes:
(1) This analysis focuses on 506 transactions meeting these specs closed in 2017 and 2018. We did not adjust for size differentials – a regular feature of analysis in our reports. The analysis is limited to NAICS groupings meeting minimum deal count thresholds in order to blunt deviations due to deals size.)
Andy Greenberg is CEO of GF Data®, based in suburban Philadelphia, and Managing Director of TM Capital, a mergers & acquisitions advisory firm with offices in New York, Atlanta and Boston. GF Data is the leading providing of valuation, volume, leverage and key deal term information on private transactions in the $10 million to $250 million value range. All charts and data subject to the GF Data terms of use. For more information, visit www.gfdata.com.