![]() GF Data just released a lively 2012 year-end report based on our collection of valuation, leverage and key deal term data from private equity firms completing deals in the $10 million to $250 million Total Enterprise Value (TEV) range.
GF Data just released a lively 2012 year-end report based on our collection of valuation, leverage and key deal term data from private equity firms completing deals in the $10 million to $250 million Total Enterprise Value (TEV) range.
: published PEP Digest …
Here are the top three takeaways from the 2012 year-end report (GF Data: 2012 Fourth Quarter Saw Explosion in Deal Volume):
- Lower middle market deal activity reached valuation and volume levels not seen since 2007, primarily fueled by a record fourth quarter.
- We passed an important internal milestone – more than 200 private equity firms are now represented in our data base.
- Finally, the year-end report marked the debut of data we’ve been collecting over the past year on the nature of the selling entity (e.g., individual/family versus institutional) and the extent of senior management continuity post-closing.
Now seems like a good time to reflect on what GF Data has learned over the past six years about how middle-market businesses are valued by their buyers.
Soon after Graeme Frazier and I began the business in 2006, I found myself in a spirited Q&A after making a presentation on our fledgling product at an industry conference. It’s simple, one valuation practitioner said. We’ll identify for you the 25 or 30 factors that go into the pricing of a business asset, you collect the data from the private equity firms, and we’ll work together to develop a regression analysis that calculates the expected value of a particular business and we can compare that to what the company actually trades for.
Basically, we were being invited to re-invent arbitrage pricing theory.
More fundamentally, though – Graeme and I were a couple of deal guys being dragged into an eternal question endlessly studied by economists and corporate finance scholars: To what extent is business valuation a science, not an art?
We’ve collected data on more than 1,600 private equity-backed transactions. The short answer is that the market-clearing price for a business will always reflect some degree of subjectivity, judgment and guesswork on the part of the prospective buyers. GF Data, however, has been able to identify clear benchmarks for what is “market” in a given industry space, where previously middle-market sellers could only base their expectations on multiples and deal structures disclosed for larger transactions.
Disparities based on industry and deal size have always been there to see in data collected by us and others. About five years ago, we began to include some measure of business quality by stratifying deals based on two high-level financial characteristics – EBITDA margin and revenue growth rate. Today, GF Data classifies “above-average” performers as firms with both metrics exceeding 10 percent for the trailing twelve month period, or one above 12 percent and the other above eight percent.
We always are careful to explain that the other businesses in our universe aren’t bad – each got to closing with a presumably sophisticated financial buyer. So, it is really a measure for comparing “A” properties to “B” properties. The pricing differential has averaged about .3x EBITDA.
That spread has struck many of our contributors and subscribers as low based on their experience. It felt that way to us as well. Earlier this year, we surveyed the private equity groups that give us data, along with the M&A firms, law firms, valuators and others who subscribe to our reports and data base on what seemed to be the next most significant factor driving business pricing – the quality of management and the extent to which key managers remain with a business post-close.
More than 60 private equity firms weighed in, many sharing insights on how they measure management as a component of each investment proposition. These discussions confirmed that – no surprise – quality management is pretty darn important. It also became clear that many of the more successful private equity firms regard their assessment of management as part of their “secret sauce.”
We toyed with trying to capture that element of tradecraft by asking our data contributors to provide ratings on various aspects of senior management’s performance. In the end, though, we went for two more “objective” questions: Is key management continuing for more than a transitional period post-close? If so, and if it is desired, is key management retaining equity in the business?
Here are a few preliminary conclusions:
- Whether or not a middle-market business comes with intact, equitized management is a key factor in valuation.
- It appears to be intertwined with the company’s achieving above-average financial results – e.g., the premium accorded for both factors together is greater than “one plus one.”
- As businesses get larger within our data set – the ceiling is $250 million TEV – there appears to be a greater premium available for more desirable properties.
We now have the data to attempt an interesting parlor game – deconstructing the valuation of a highly valued business.
Our data contributors reported on 208 completed transactions in 2012. For this exercise, we cut that pool further in two ways. First, of the four broad industry categories most heavily represented in our data base, health care services is consistently valued more highly than the other three – manufacturing, business services and distribution. We eliminate all others and compare valuations in health care services (HCS) to a combination of the other three (EX-HCS). (While there are highly valued niches in the EX-HCS sectors as well, this segregation works for a broad brush analysis.)
Then, we exclude all transactions other than buyouts and leveraged recapitalizations. As a result of these cuts, we end up with a sample of 160 transactions completed in 2012 with TEV of $10 million to $250 million and TEV/adjusted EBITDA multiples of 3-12x.
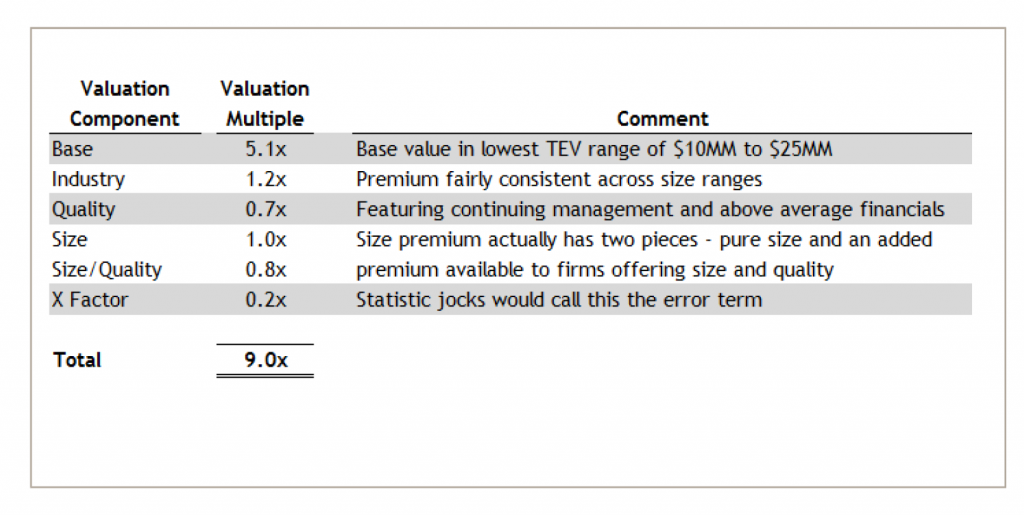
Within this sample, it stands to reason that the lowest valued businesses will be in the EX-HCS industry bucket, in our lowest TEV range ($10 million to $25 million), and lacking both above-average financial characteristics and management continuity. The valuation for this profile: 5.1x TTM adjusted EBITDA.
Conversely, the most richly valued firms should be in the HCS sample, in the highest TEV bracket ($100 million to $250 million), with above-average financial results and continuing management. The valuation for this profile: 9.0x TTM adjusted EBITDA.
Based on our data, we offer this as the build-up of the 9.0x valuation for a good-sized, well-performing business in a desirable industry area:
We look forward to being able to offer increasingly more granular views of these components as we collect data on more transactions over time.
About the author: Andrew Greenberg is CEO of GF Data and Managing Director of Fairmount Partners, an M&A firm. Both are based in West Conshohocken, PA.
(c) 2013 PEPD * Private Equity’s Leading News Magazine * 3-7-13