
The valuation gap between large and small middle-market platforms has widened to its highest level in over a year, creating new challenges (and opportunities) for sub-$100 million companies.
The middle market has always rewarded scale, but the third quarter of 2025 brought a sharp reminder of just how much size matters in today’s deal environment.
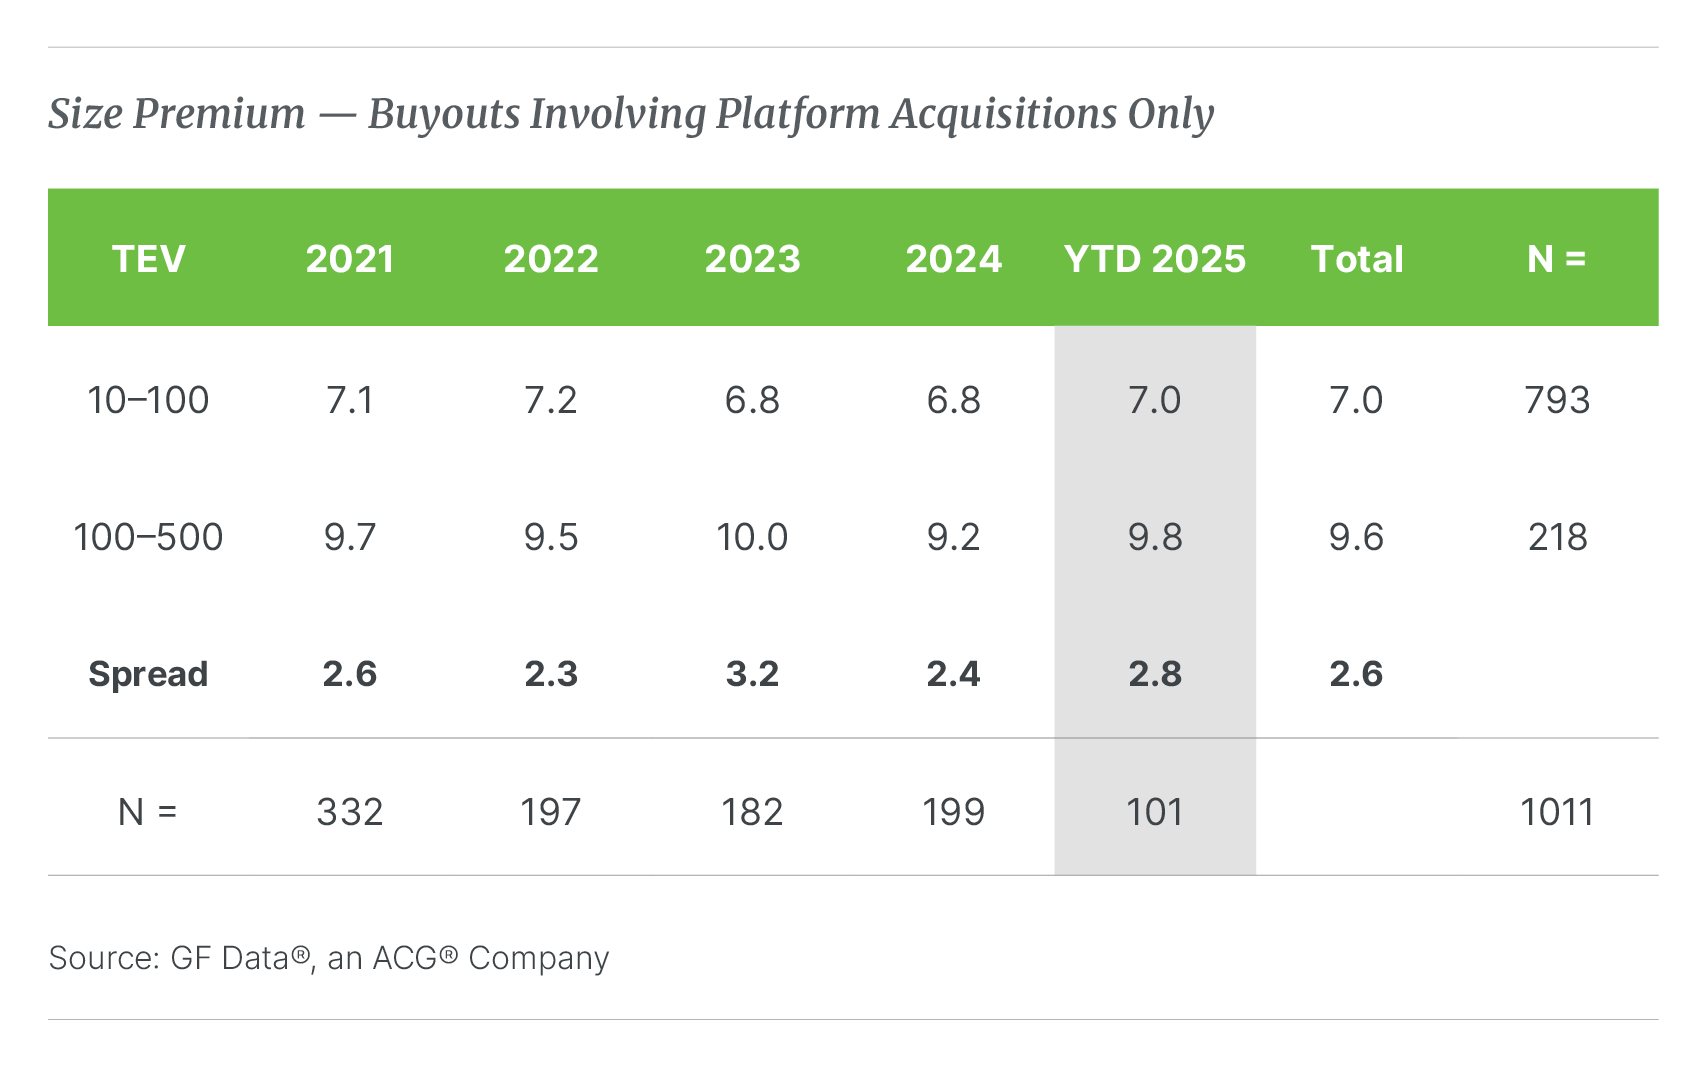
According to GF Data’s Q3 2025 M&A Report, the valuation spread between large platform buyouts (those with total enterprise value, or TEV, between $100 million and $500 million) and smaller platforms (sub-$100 million TEV) expanded to 2.8x in the first nine months of 2025. That’s up from 2.4x through the first half of the year and slightly above the long-term average of 2.6x.
For context, larger platforms are now commanding average valuations of 9.8x trailing twelve-month (TTM) EBITDA, while smaller platforms are trading at 7.0x; a difference of nearly three full turns of EBITDA.
The widening spread reflects what GF Data contributors are calling “renewed investor preference for scale and creditworthy assets amid tighter lending conditions.” In plain terms:
larger companies are pulling away because they can access capital more easily, weather economic uncertainty more confidently, and command higher exit multiples when it’s time to sell.
For founders, family owners, and advisors working with sub-$100 million platforms, this raises an urgent question: How do you compete when the market is structurally tilted toward scale?
What’s Driving the Size Premium Expansion
The return of a more pronounced size premium isn’t happening in a vacuum. It’s the result of several converging market forces that became particularly visible in the third quarter.
First, credit conditions continued to tighten. Total debt utilization across platform deals fell from 3.3x EBITDA in 2024 to 3.2x EBITDA through the third quarter of 2025, according to GF Data’s leverage data. Senior debt coverage also declined, averaging 2.6x in 2024 compared to 2.3x through the first nine months of 2025. Lenders are applying what contributors describe as “stricter underwriting standards,” particularly for smaller platform transactions.
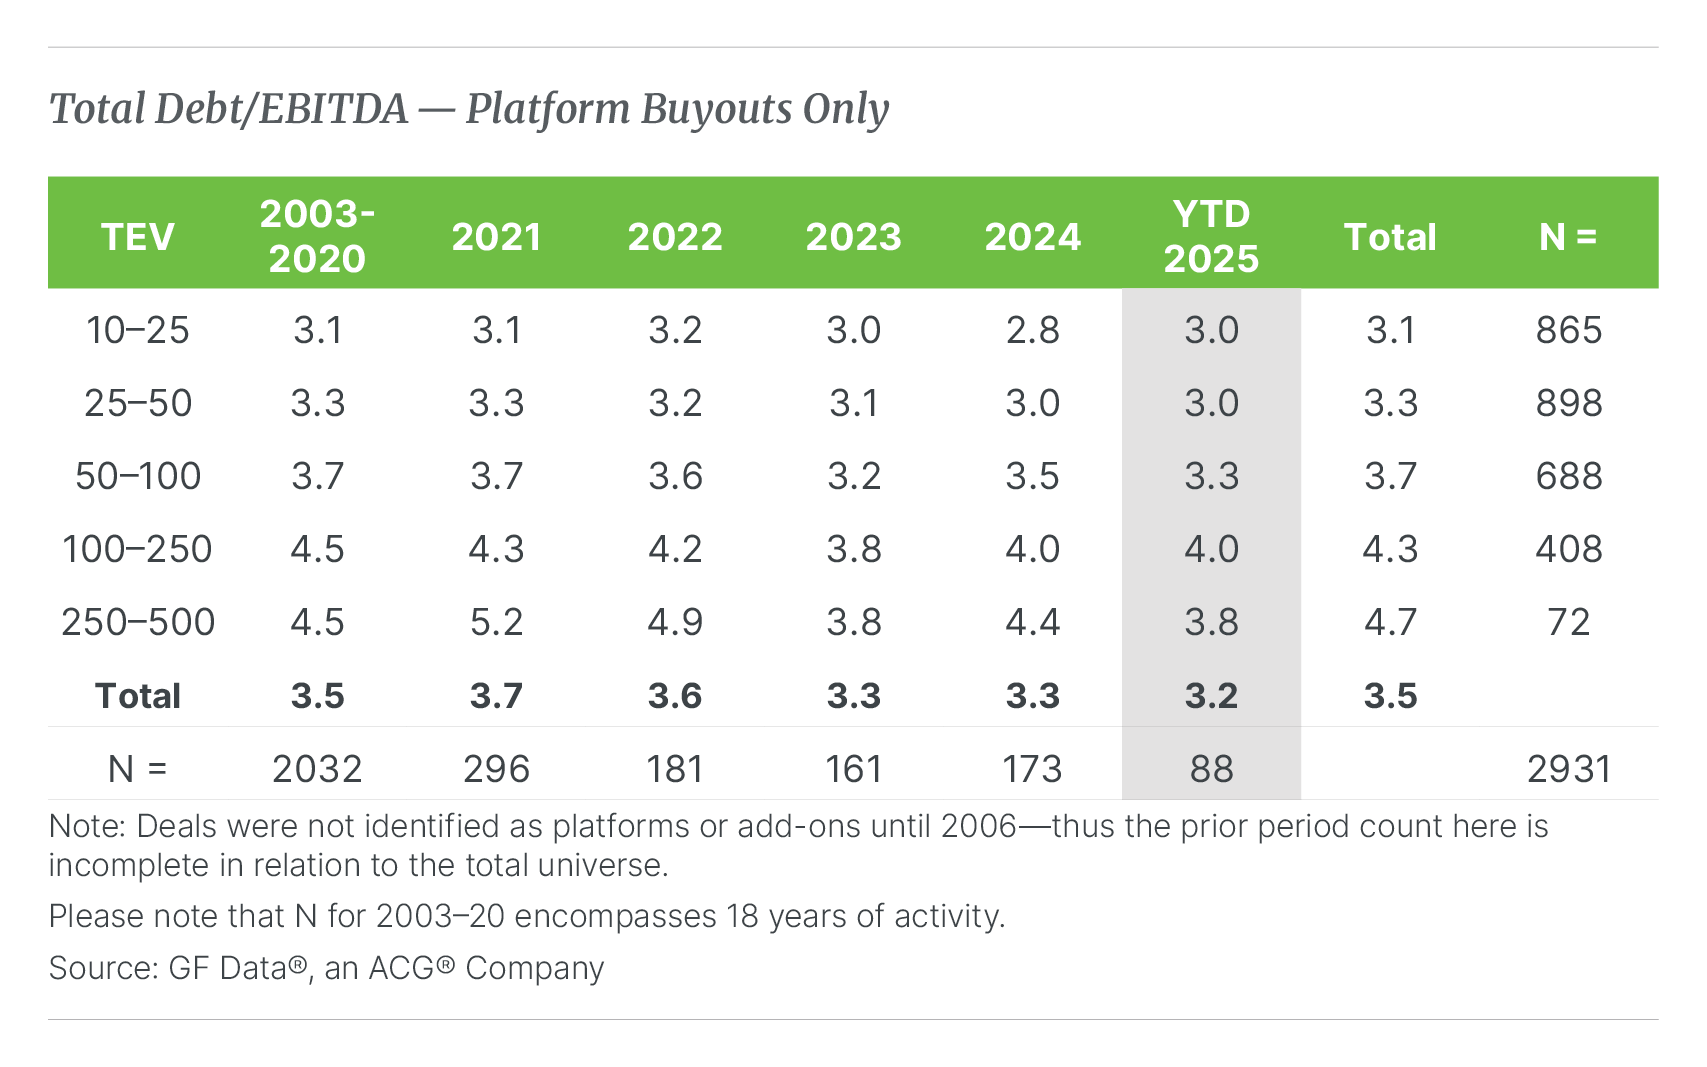
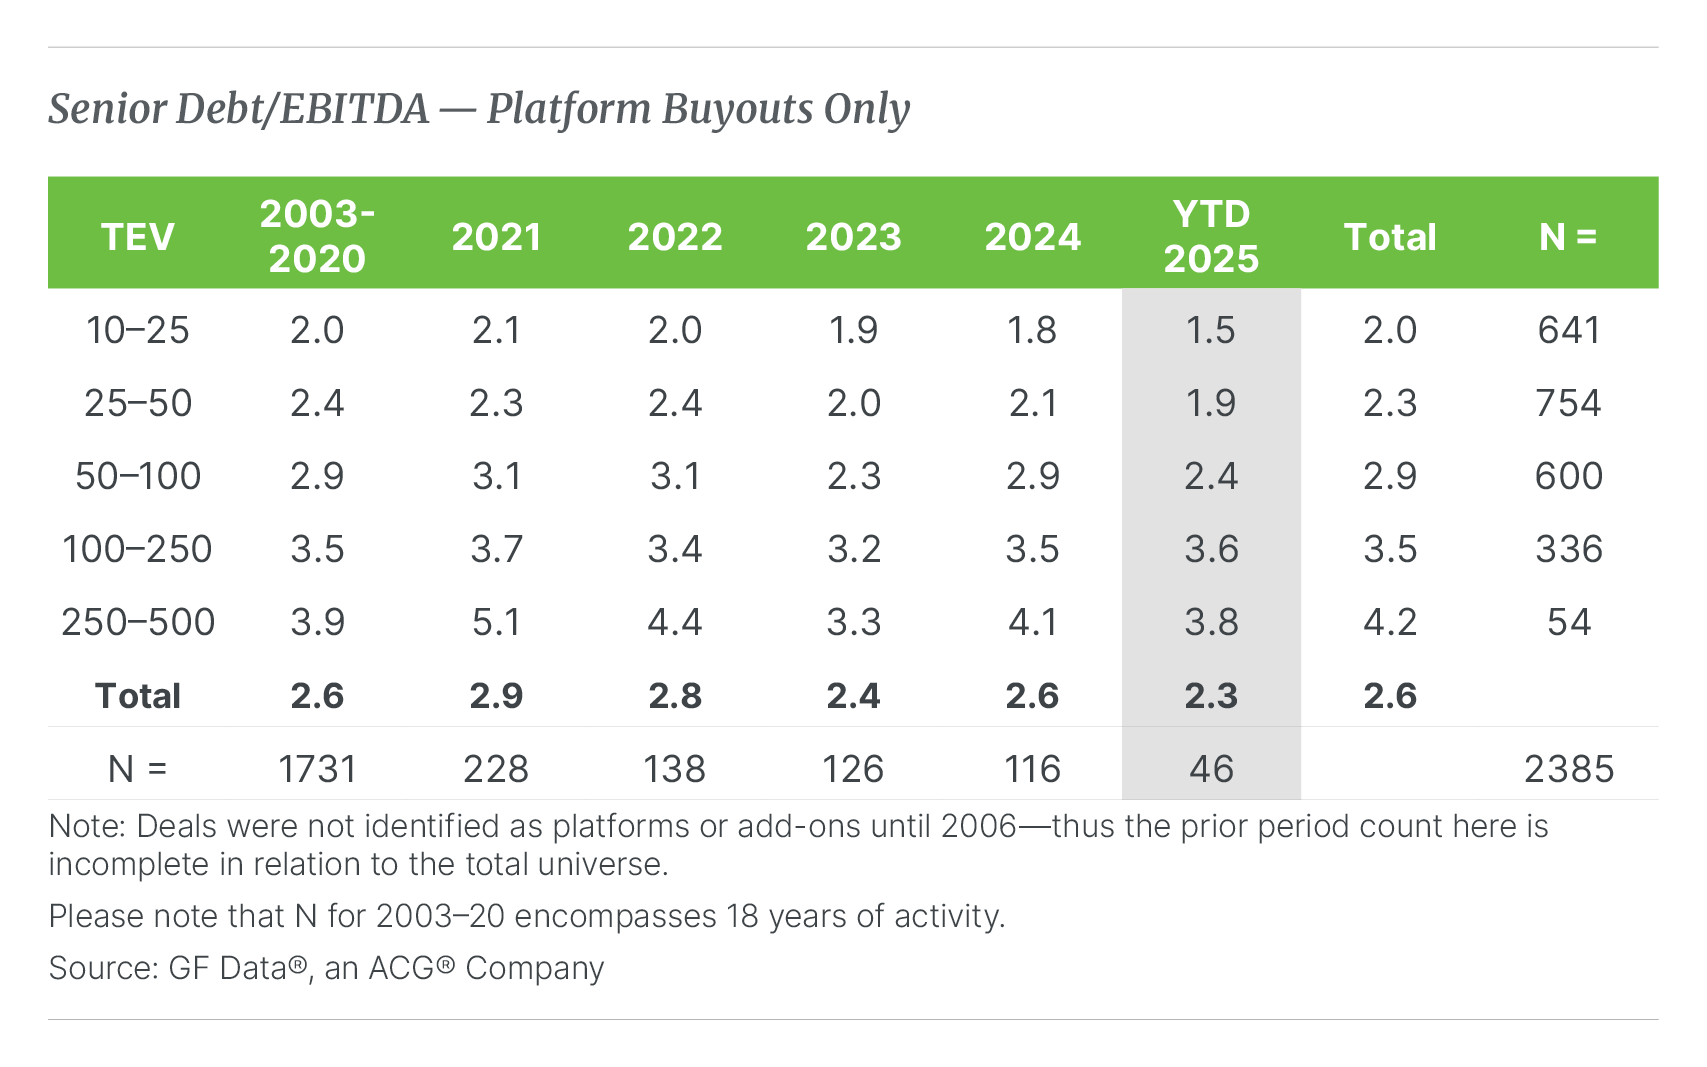
Translation: Banks are demanding higher equity contributions and more conservative capital structures from smaller companies, making it harder for sub-$100 million platforms to access the same leverage multiples that larger competitors can command.
Second, larger companies are perceived as safer bets in an uncertain macroeconomic environment. They typically have more diversified customer bases, more professional management teams, and more established market positions. All of which reduce risk in the eyes of both lenders and equity investors.
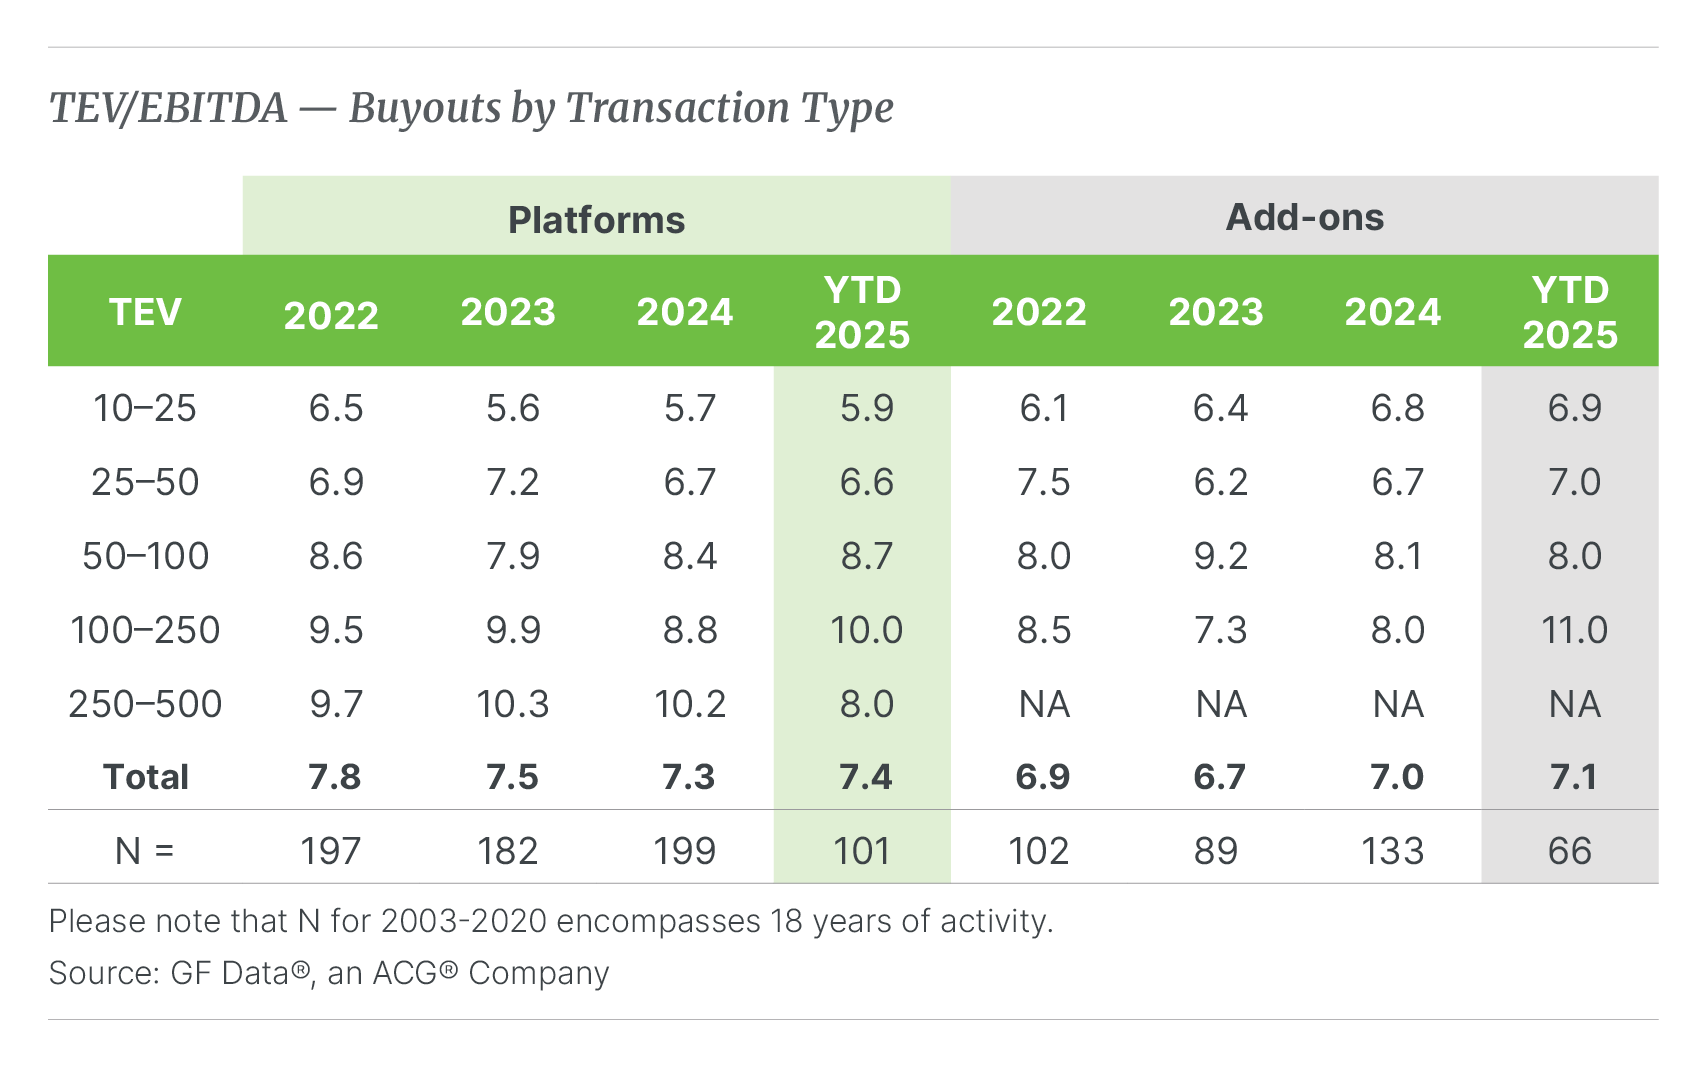
Third, the quality premium has collapsed to historic lows. Companies with above-average financial performance are receiving only a 2 percent premium over other buyouts (7.3x versus 7.1x)—the lowest spread in GF Data’s tracked history. When buyers aren’t willing to pay meaningful premiums for strong financial performance, they default to paying for size instead.
The result is a market where scale has become the primary differentiator, and smaller platforms are structurally disadvantaged.
The Challenge for Sub-$100 Million Platforms
Let’s put some numbers to the challenge.
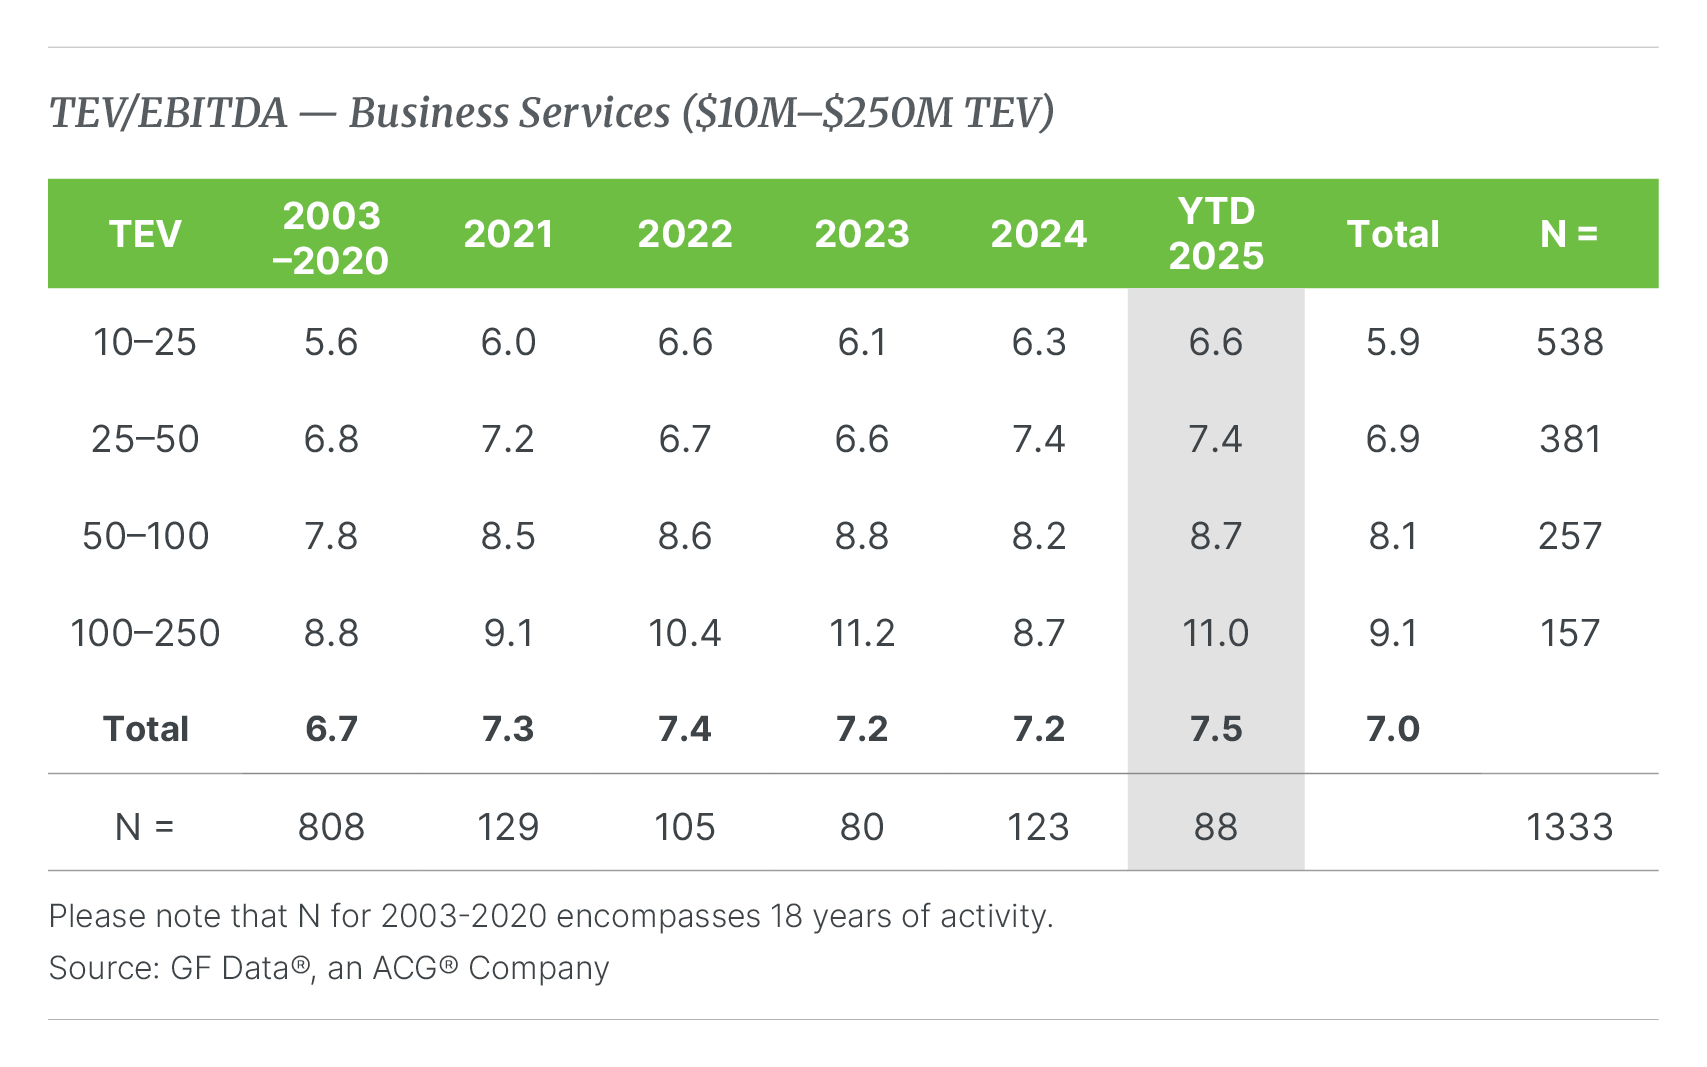
According to GF Data’s Q3 data, platform buyouts in the $10 million to $25 million TEV range are averaging 5.9x EBITDA. Those in the $25 million to $50 million range are averaging 6.6x. The $50 million to $100 million tier comes in at 8.7x.
Meanwhile, platforms in the $100 million to $250 million range are averaging 10.0x EBITDA, nearly 70 percent higher than the smallest tier and 15 percent higher than the $50 million to $100 million segment.
For a $40 million TEV company with $6 million in EBITDA, that 2.8x size premium represents roughly $17 million in enterprise value that’s on the table simply because the company isn’t bigger. That’s not a rounding error; it’s a fundamental market reality that owners and advisors need to address.
The traditional advice would be to “grow your way into the next tier,” but that’s easier said than done, especially when credit is tight; hiring is expensive; and macroeconomic uncertainty makes aggressive growth strategies risky.
So, what’s the alternative?
Employee Ownership as a Competitive Differentiator
This is where employee stock ownership plans, or ESOPs, enter the conversation—not as a fallback option for companies that can’t attract traditional buyers, but as a strategic tool that can create competitive advantages independent of company size.
As Jeff Buettner, Managing Director at ButcherJoseph & Co., notes in a recent article featured in ACG’s publication Middle Market Growth: “The performance benefits of employee ownership are well-documented. ESOP-owned companies consistently demonstrate higher productivity, profitability, and employee retention than their peers. That’s because ownership fosters alignment as every team member has a vested interest in driving enterprise value.”
The productivity, profitability, and retention advantages that Buettner describes translate directly into the financial metrics that drive valuations: EBITDA margins, revenue growth, customer retention, and operational efficiency.
In other words, employee ownership creates a “durable competitive advantage” (Buettner’s phrase) that doesn’t require the company to be larger, better capitalized, or backed by a marquee private equity sponsor.
For sub-$100 million platforms competing against larger, better-resourced competitors, that alignment matters. A highly engaged, ownership-minded workforce can outperform a larger competitor’s disengaged employee base, especially in labor-intensive sectors like business services, healthcare, manufacturing, and distribution.
The Tax Advantage That Levels the Playing Field
Beyond the operational benefits, ESOP structures offer tax advantages that can help smaller companies bridge the valuation gap created by the size premium.
When a company converts to an ESOP and elects S-corporation status, the portion of the company owned by the ESOP becomes exempt from federal income tax. For a company that’s 100 percent ESOP-owned, this means the elimination of corporate-level federal income tax; an effective tax savings of 30 to 35 percent on pre-tax earnings.
Let’s return to our hypothetical $40 million TEV company with $6 million in EBITDA. At current market multiples, traditional buyers might offer 6.6x, or roughly $40 million. But if that company transitions to an ESOP, the S-corp tax savings could create an additional $2 million per year in cash flow (assuming a 35 percent effective tax rate).
That incremental cash flow doesn’t just improve the company’s operations; it accelerates debt paydown, strengthens the balance sheet, and creates the foundation for growth that might eventually push the company into a higher valuation tier.
Additionally, selling shareholders can defer capital gains taxes through a 1042 rollover, and ESOP loan principal payments are tax-deductible. Benefits that don’t exist in traditional private equity or strategic transactions.
The result is a structure that delivers effective valuations above nominal market multiples, even when the company can’t command the same headline multiple as a $200 million platform.
Sector-Specific Opportunities
The size premium isn’t uniform across all sectors, and that creates targeted opportunities for ESOP strategies.
In business services, for example, the $100 million to $250 million tier is trading at 11.0x EBITDA (the highest multiple in the dataset) while the $25 million to $50 million tier is at 7.4x. That’s a 3.6x spread, well above the overall market average.
Business services companies are also highly people-dependent, making them natural candidates for employee ownership. As Buettner puts it: “For middle-market executives and investors alike, this translates into a durable competitive advantage: a motivated workforce, stable leadership continuity, and a capital structure designed to sustain long-term growth.”
Similarly, in healthcare services, the $50 million to $100 million tier is trading at 9.2x EBITDA, while the $10 million to $25 million tier is at 6.0x; a 3.2x spread. Healthcare is notoriously labor-intensive and faces acute competition for skilled talent, making workforce retention a critical driver of enterprise value.
Manufacturing shows a more modest but still meaningful spread, with the $100 million to $250 million tier at 9.8x and the $25 million to $50 million tier at 6.0x. Buettner’s manufacturing case study is illustrative here: “We recently advised a manufacturing company whose founder was ready to diversify personal wealth but reluctant to sell to a competitor. Through an ESOP transaction, he achieved meaningful liquidity, rewarded long-tenured employees, and positioned the business for continued growth under familiar leadership. A year later, the company is outperforming projections with stronger employee engagement and a renewed sense of shared purpose.”
In each of these sectors, employee ownership offers a pathway to competitive differentiation that doesn’t depend on achieving the scale required to command premium multiples in traditional M&A transactions.
The Strategic Positioning Question
It’s important to be clear about what employee ownership does and doesn’t do.
An ESOP doesn’t magically transform a $40 million company into a $200 million company. It doesn’t eliminate the operational advantages that come with scale: economies of scope, purchasing power, deeper management benches, and so on.
What it does do is create a different kind of competitive advantage. One rooted in workforce alignment, tax efficiency, and cultural continuity rather than sheer size.
As Buettner observes: “At ButcherJoseph & Co., we believe the future of the middle market will belong to companies that successfully integrate financial strategy with human capital strategy. Employee ownership enables that integration by aligning purpose with performance, helping founders transition, investors innovate, and teams thrive.”
For smaller platforms facing a 2.8x size premium, the question isn’t whether to compete with larger companies on their terms; it’s whether to compete on different terms entirely.
Looking Ahead
The third quarter of 2025 brought some encouraging signs for the middle market overall. Average purchase price multiples rebounded to 7.5x TTM EBITDA, up sharply from 6.9x in the second quarter, driven by renewed activity in leveraged recapitalizations and growth financings.
But those gains were concentrated in the $50 million to $250 million TEV tiers. Smaller deals, precisely the segment facing the widest size premium, saw little change.
If credit conditions remain tight and investors continue to prioritize scale, the size premium is unlikely to compress meaningfully in the near term. That makes strategic positioning even more critical for sub-$100 million platforms.
Employee ownership isn’t the only answer, but it’s an underutilized one. Particularly in sectors where human capital is the primary asset and where workforce engagement directly drives financial performance.
As Buettner concludes in his analysis: “As the middle market continues to evolve, ESOPs deserve a fresh look—not as an alternative to growth, but as a catalyst for it.”
For smaller platforms looking to compete in a market that increasingly rewards size, that catalyst may be exactly what’s needed.
About the Data
The analysis in this article is based on GF Data’s Q3 2025 M&A Report, which tracks middle-market transactions with total enterprise values between $10 million and $500 million. The dataset includes 211 transactions completed through the first nine months of 2025, contributed by 437 participating private equity firms. Access the latest report with data-driven insights for ESOP advisors and learn how GF Data supports ESOP valuations with the most relevant private-market data.
Latest ESOP Report
GF Data publishes quarterly reports on M&A, Leverage and Key Deal Terms. Access the latest special report with data-driven insights for ESOP advisors.