CEO GF Data® and Greenberg Variations Capital
As my GF Data partners and I travel the country, one question dominates every conversation regarding this improbably long-lived seller’s market: “What inning is it?”
It’s like being a parent in the first year of kid-pitch baseball.
Prognosticating about or attempting to “time” the market is notoriously risky.
However, we operate at the confluence of three sources of information – (a) the collection and analysis of metrics submitted to GF Data by PE firms and other sponsors on transactions they complete in the $10-250 million value range; (b) our interactions with our contributors, subscribers and other deal professionals; and (c) our own experiences in the deals business.
All of this has led us to consider a related and safer question – how will we know if and when the market is about to turn?
While there are many possible indicators, we see three that should resonate with business buyers, money sources and advisors. GF Data measures one of the three; the summary below starts there.
Indemnification Cap.
As regular readers of our reports know, we are committed to the idea that deal points other than price tend to be lagging indicators in a rising market (from the business seller’s perspective). Would-be acquirers exhaust themselves on price, then compete on the balance of the term sheet. It follows, then, that the same deal terms are leading indicators in a falling market – buyers pull back on these sweeteners before asking sellers to accept concessions in headline economics.
In recent years, the general cap on indemnification against breaches of reps and warranties seemed to fit this observation. Overall valuations across our entire sample have plateaued in the low-to-mid seven range. (This includes much higher multiples on larger deals and transactions in favored sectors.)
With valuations having flattened out, average cap continued to go the sellers’ way, falling steadily from an average of 17.3% of total enterprise value in 2014 to 12.1% in 2017. In 2018, though, we recorded a reverse. Average cap for that year edged back up to 15%. At the time, we asked whether this was a sea change, an aberration, or a reflection of changes in the market as a result of the continued proliferation of rep and warranty insurance.
With the added perspective of the year to date, it appears not to have been a sea change. The average cap in the first six months of 2019 was 9.8%, the most favorable mark yet from the sellers’ perspective. Our best guess is that the blip was due to the other two factors – part random fall of the data and part a consequence of the risk profile of deals being completed without an insurance product.
As the chart below shows, in 2018 indemnification cap jumped slightly on deals completed w RWI, while popping 6.5 percentage points on those completed without. In 2019 YTD, experience in both groups has fallen back in line with 2017 experience.
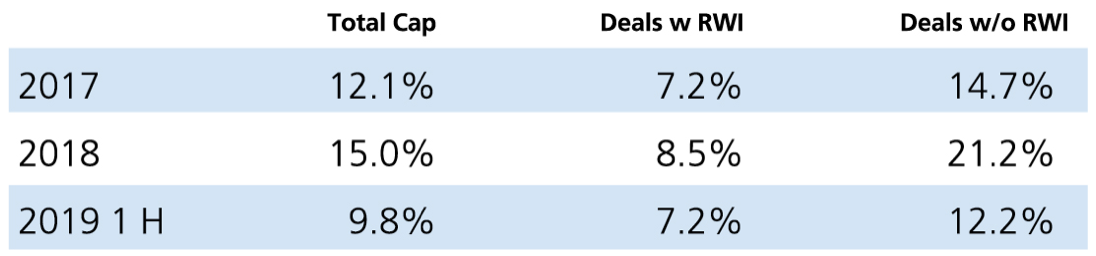
SOURCE: GF DATA®
Business sellers have also benefitted over the past decade from a marked expansion in the nature and extent of addbacks and other adjustments to EBITDA advocated on their behalf.
Acquirers, advisors, funding sources and financial due diligence advisors have all seen the shift. Ten years ago, a seller could not expect to get credit, for example, for the benefit of closing a facility or eliminating purportedly redundant staff still on the payroll. “You’ve run the business this way yourself,” buyers would say. “Make the change, show that you’ve cut fat not muscle, and if you’re still in market in six months, we’ll give you credit for it.”
Providers of quality of earnings reports and other sell-side due diligence still show these pro forma adjustments “below the line” – but it is more routine for investment bankers to ask buyers to incorporate these items into their view of a given business. The larger and more desirable the property, and the frothier the competitive brew, the more likely these adjustments are to stick.
One would expect that this dynamic would have led to the “Adjusted” component of “Adjusted EBITDA” increasing over time. According to Lincoln International, this has occurred. Lincoln’s valuation practice produces outstanding analysis based on its quarterly review of portfolio holdings on behalf of private equity clients.
They report that adjustments on average accounted for 24.1% of adjusted EBITDA in 2Q 2019 – a steady rise from 21 percent in 4Q 2016. Going back to 4Q 2013, the adjustments share was about 15%.
Adjustments as a % of Adj. EBITDA
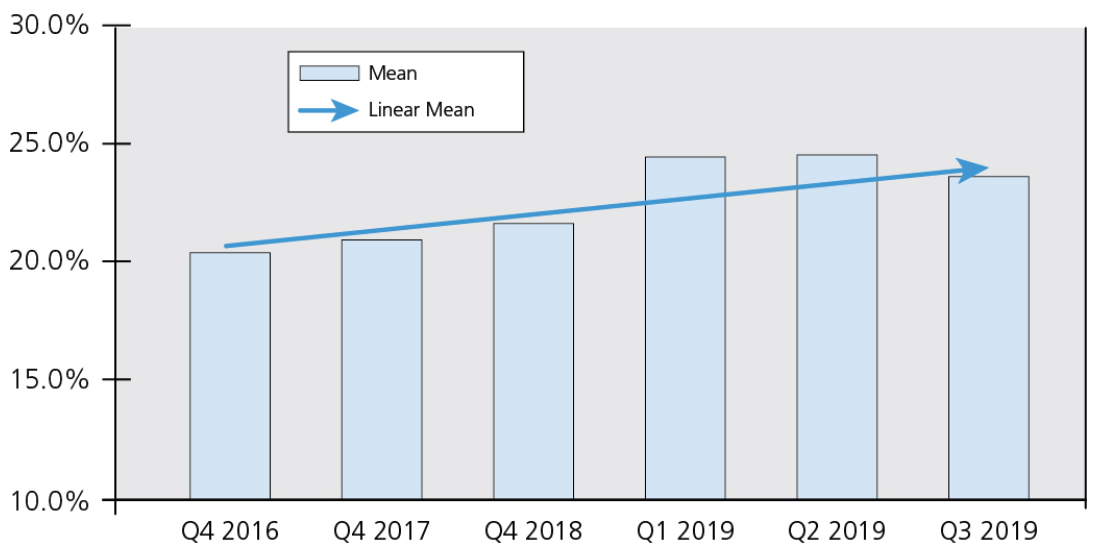
SOURCE: Lincoln International® https://www.lincolninternational.com
If the “adjustments” portion of Adjusted EBITDA reverses course and begins to decline, it will suggest that this stealthful dynamic has begun to take hold, and will be another precursor of a more visible market shift.
Commercial Bank Lending.
Finally, we believe it is useful to keep a close watch on how acquisitions are being financed.
Over the past decade, we all have seen commercial banks — with a handful of exceptions – give the field of cash-flow based acquisition finance over to Business Development Corporations (BDCs), credit funds and other non-bank lenders. Limitations on leverage, government regulations, risk-averse credit cultures, and an exodus of seasoned lenders have combined to reinforce their sideline status.
GF Data’s November report captured the continued availability and use of debt helping to sustain equity values. The total debt on deals completed with BDCs in 2019 year to date is 5.1x EBITDA.
However, it is possible for two things to happen at once. There is evidence that a segment of the market is coming back to commercial banks.
We ask our private equity data contributors to characterize the debt posture they have taken on each transaction. They tell us whether they believe the debt component is: (a) at or close to the maximum available, (b) less than the maximum available; or (c) based on the characteristics of an entity other than the business being acquired (e.g., an existing portfolio company).
The percentage of deals completed with maximum leverage has declined over the past three years – from 43 percent in 2017 to 41 percent in 2018 to 39 percent in the year to date. We believe this shift reflects buyers choosing more conservative capital structures for smaller businesses, for those with cyclical or regulatory risk and for those that do not play off of the most compelling demographic and economic trends.
Churchill Asset Management’s market letter The Lead Left takes a broader view of market share in leverage finance, drawing on data from several sources. As the chart below indicates, commercial banks have gained share in the year to date, rising to 14.8 percent. This is the greatest level of bank participation since 2011. Note that this data comprises institutional loans; presumably, the profile of commercial banks would be magnified on non-institutional deals.
Primary Investor Market: Banks vs Non-Banks
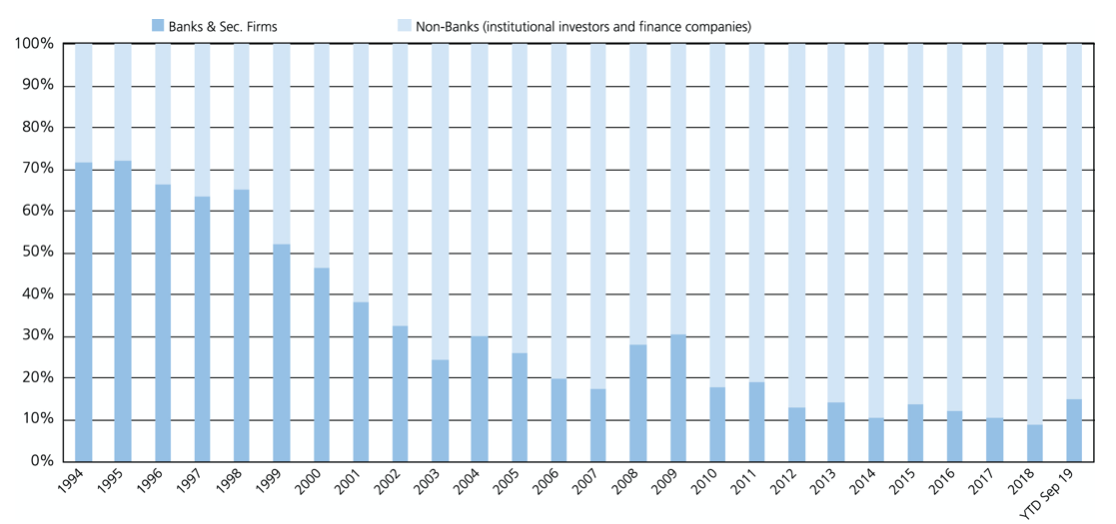
SOURCE: The Lead Left, Wells Fargo, S&P LCD Capital IQ
We appear not to be in the ninth inning, but there are always some who want to beat the rush to the parking lot.
Andy Greenberg is CEO of GF Data® and of Greenberg Variations Capital, a mergers & acquisitions advisory firm devoted to one-off or targeted transactions. GF Data is the leading provider of valuation, volume, leverage and key deal term information on private transactions in the $10 to $250 million value range. GF Data and GVC are both based in suburban Philadelphia. All charts and data are subject to the terms of use of the sources cited in this commentary.