![]() Deal professionals talk about the capital market environment as obsessively as sailors talk about weather. : published PEP Digest …
Deal professionals talk about the capital market environment as obsessively as sailors talk about weather. : published PEP Digest …
The question about prevailing conditions that comes most often to GF Data is that of current debt tolerances. What are the true limits on senior and total debt for deals of particular size, quality, structure and industry at any moment in time?
As GF Data collects and analyzes information submitted by more than 180 middle-market private equity funds each quarter, reporting on leverage has turned out to be more complicated than reporting on valuation.
For the year to date, valuations in the GF Data universe have averaged 6.4x Trailing Twelve Months adjusted EBIT DA, including average buyer’s transaction expenses of about .3x. There may be some room for interpretation in that number, but most of us in the industry understand what that says about values in the overall market.
In the same period, Total Debt/EBIT DA on reported transactions averaged 3.2 times Adjusted EBIT DA. But what does that number mean? It includes deals done by: (a) PE sponsors using maximum available leverage;
(b) sponsors that make a point of using less than the available debt; (c) family offices, PE platform companies or others completing the transaction based on resources other than those of the property being acquired; and
(d) users of the increasingly popular single tranche products.
We are left with an amalgam of different kinds of transactions rolled up into an aggregate view of total leverage. It’s a number that manages to be accurate without being particularly useful.
For much of this year, we’ve been trying to figure out how to get to a better level of definitiveness in reporting on debt loads. So me additions to our data template, to be previewed later in this article, are giving us a great running start, but it has been a complex challenge.
We’ve discovered that the nature of the leveraged finance market contributes to its relative opaqueness. The universe of debt providers on private equity-backed transactions is much more concentrated than the universe of equity sponsors themselves. GE Capital Antares has a market share estimated by others at 35-40 percent. Throw in the leading finance companies and banks, and the top 10 debt providers account for perhaps 80 percent of the dollar volume. By contrast, the market share of any of the most active middle-market sponsors – an HIG or a Riverside – would be in the single digits.
As a result, the leading middle-market lenders believe they can track a substantial swath of the relevant market internally based on the deals shown to them. They also have reason to believe that it is challenging enough to identify and capture market anomalies without adding to the pool of externally available information.
The two established reporting services focused on lender volume, Thomson Reuter’s Loan Pricing Corporation and Standard & Poor’s LCD, are well suited to the structure and predilections of the capital providers themselves. They report aggregate data and “league tables” that can be tailored to each contributor’s areas of strength.
Since the beginning of this year, we’ve asked our data contributors to describe the “debt posture” taken on
each transaction. This has enabled us to begin to differentiate among the cases described above. In combination with the other data, it is possible to form a more clear view of prevailing debt levels in different circumstances.
Within the larger universe of reported transactions, our private equity data contributors completed 30 leveraged recaps or buyouts meeting GF Data’s core parameters – total enterprise value of $10-250 million, TEV/adjusted EBIT DA of 3-12x — and employing so me level of leverage. The valuation, leverage and capital structure metrics for these deals are as follows:
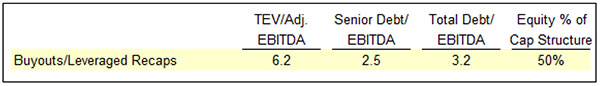
Again, reported debt levels that are presumably accurate but not particularly useful. Our expanded data template, however, enables us to drill down and disaggregate the data based on the acquirer’s chosen approach to leverage:
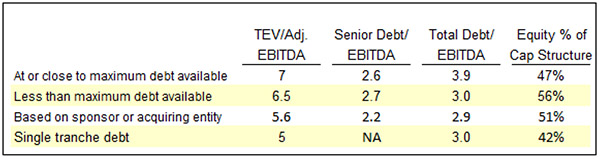
Within this sample, we conclude that:
- “Market” tolerances for total debt in the first six months of this year – meaning the maximum amount available – averaged 3.9x — .7x greater than reflected in the aggregate data.
- Average equity was on average 47 percent of capital structure for buyers optimizing available debt, while those consciously “under- leveraging” contributed 56 percent.
- More aggressive users of debt push harder on junior capital rather than senior debt. Senior debt was in the 2.6-2.7x range for those maxing out on debt and those choosing not to.
- Add-on acquisitions and other transactions funded through the cash flow/balance sheet of a larger entity were on average more lightly valued and used less debt.
- Single tranche debt has become a useful tool for smaller, lower-valued properties as well as for those commanding above-average multiples.
The ability to crosscut deal data by industry, deal size and deal quality will pro vide added detail as we attempt to describe the winds and currents of the capital market.
GF Data Resources provides data on private equity sponsored M&A transactions with enterprise values of $10 million to $250 million, offering private equity firms and other users external information to use in valuing and assessing M&A transactions. GF Data collects transaction information from private equity groups on a blind and confidential basis. Data contributors and paid subscribers receive two products
Download Article (PDF)