The analysis surrounding GF Data’s quarterly reports usually is based on observing some trend or anomaly in the data and then drawing from practical deal-making experience to explain it.
Lately, though, we’ve been thinking about the state of the capital markets serving private middle market M&A in the opposite manner — starting with a real-world hypothesis and looking to see the extent to which it is reflected in our data on recent deal activity.
Here is the hypothesis:
Deal activity and valuations in the lower middle market are being driven not so much by the “equity overhang” that has been so frequently commented on in recent years, but by the unprecedented amount of “middle of the balance sheet” debt financing now available to financial buyers.
This hypothesis is drawn from our own experience as deal professionals, as well as conversations with other advisors, lenders and acquirers. These exchanges tend to focus on four inter-related trends:
- Six years after the global financial meltdown, it is clear that all but a handful of commercial banks have lost their enthusiasm for cash flow-based lending as an ongoing line of business.
- To a great extent, the void has been filled by non-bank financial institutions with greater risk appetites and fewer regulatory restrictions.
- An important subset of the non-bank financing is coming from the Business Development Corporations (BDCs) whose leverage tolerance is enhanced by their own ability to raise capital in the public equity market.
- These developments have led a number of mezzanine funds and other sub debt providers to deemphasize –
or move entirely away from — the sub debt model and joining the confluence of capital looking to be deployed in the middle of the balance sheet.
Depending on the circumstances, it may be labeled “last-in”, “stretch” or second-lien senior debt. It may be provided on top of a traditional cash-flow based senior debt position, or combined with senior in the “uni-tranche” structure that has gained so much traction in the last few years.
In the end, it is all about the market taking a different view of risk and pricing on the swath of debt incurred after the traditional senior lenders are done, whether that view is provided in a stand-alone product or embedded in a blended structure.
The question is, if this trend is as pronounced as we hear and think it is, how is this capital influx permeating the data we collect from 200 private equity firms and other sponsors on the deals they complete in the $10 million to $250 million value range?
Here are a few signs of the competitive fray:

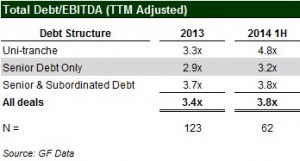
(1) — Deals featuring the newer products are providing most of the upward pressure on leverage multiples: As most of us would expect, debt loads have continued to heat up over the past year. Total debt in the first six months of 2014 averaged 3.8x TTM EBITDA, compared to 3.4x in 2013.However, as the chart below shows, deals with uni-tranche financing are accounting for most of the rise in leverage. Transactions featuring senior debt only are using somewhat more debt, while those using senior and traditional sub debt have remained essentially flat.
Multiples on uni-tranche deals averaged 2.6x in 2011 and 2.8x in 2012 before rising to 3.3x in 2013 and 4.8x in the year to date.
Greater market acceptance is translating into lower equity
contributions on a wider range of capital structures:

(2) — These rising debt multiples are not occurring in a vacuum–they are being spurred by the greater acceptance and utilization of the product by sponsors on more loftily valued transactions. In the year to date, valuations on deals utilizing uni-tranche averaged 7.7x, more than a full turn greater than valuations on deals utilizing senior and sub debt.
The result is a marked shift in average capital structure. Average equity contribution on uni-tranche deals has pushed downward toward 40 percent — in line with the equity stake on senior/sub debt deals trading at — on average — lower values.
Competitive pressure is driving down the cost of senior debt
on deals large enough to have multiple financing options:

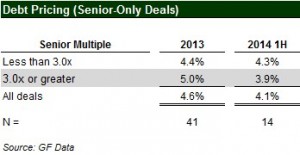
(3) — While average uni-tranche coupons have remained in the 10 percent range, there has been notable movement on senior debt borrowing costs as part of this shifting competitive landscape. Average interest rates on deals employing senior debt only have declined from 4.6% in 2013 to 4.1% in 2014. While there is no doubt intense competition up and down the balance sheet, it is the more highly leveraged deals experiencing the cost savings.
In other words, it is the deals pushing senior debt into the third and fourth turns of EBITDA that — notwithstanding the added risk — are enjoying the benefits of greater competition among lenders and among products.
Assemblers of “league tables” and others are perhaps better equipped to track the flow of funds and deal activity involving different market participants. This competition is just getting underway, though, and we look forward to continuing to use GF Data’s analytics to follow it.
.2014 PEPD * Private Equity’s Leading News Magazine * 10-6-14
“GF Data is one of the only data sources that can provide our clients with valuation data specific to the size of their business from the perspective of financial buyers.”
—Jeremy Ellis, Genesis Capital
“GF Data reports on what financial buyers are really paying for middle market companies. They also provide valuable data on leverage, pricing, and terms and conditions. There is no other reliable source for this type of data.”
—Ronald Miller, President and Managing Director, Cleary Gull Inc.
“As the leading underwriter of public capital in the BDC sector, we rely on GF Data to give us a competitive edge and keep us current on leverage and valuation levels.”
—Joe Culley, Head of Capital Markets, Janney Montgomery Scott
Contact Info:
GF Data Resources LLC
2176 Harts Lane
Conshohocken, PA 19428
610-616-4607
info@gfdata.com
News
Registered Subscribers
Subscription Renewal
New Subscription Request