A question framed by GF Data’s second-quarter report, accentuated by the recent tumult in the international and domestic equity markets, and on the minds of deal professionals:
Have the ideal market conditions — meaning “ideal” from the perspective of would-be business sellers — finally begun to crest?
Earlier this month, we were at the first stop on the Association for Corporate Growth fall circuit, the excellent Great Lakes event in Cincinnati. Conversation there fortified the impression that the private M&A market still has plenty of giddy-up in it, notwithstanding the drop in public stock prices.
Here is GF Data’s suspicion of the most likely trajectory in market conditions, followed by some thoughts on what to look for in the transaction data in coming months.
Business buyers, capital providers and intermediaries widely agree that in terms of valuations and debt support, conditions in this “seller’s market” can only move in one direction.
We believe that what we will see is some continued run on the current elevated plateau, then an unmistakable but moderate dip to another plateau. That level — still very good for sellers in historical terms but not at the current idyllic peak — will persist for some time. (This prognosis, of course, assumes the absence of any cataclysmic macro events.)
Is the moderate drop three months away or twelve? Too early to say, but here is what to watch for in our data.
In the GF Data universe — transactions reported by financial sponsors on deals they complete in the $10-$250 million range — valuations have remained stable at an elevated level reached through a steady upward push in the first few years of this decade. Within our sample — currently comprising 200 active contributors — the average valuation was 6.3x Trailing Twelve Months (TTM) Adjusted EBITDA in 2012 and 6.5x in 2013. The average mark reached 6.8x in 2014 and has remained there in the first half of this year.
While aggregate pricing has not changed much, the composition of the underlying financing has. The average equity contribution required of acquirers to get deals done (as noted in our August Leverage Report) has declined steadily over the past two years:
Deals with Financial Sponsors 2013 to 2015 (First Half)
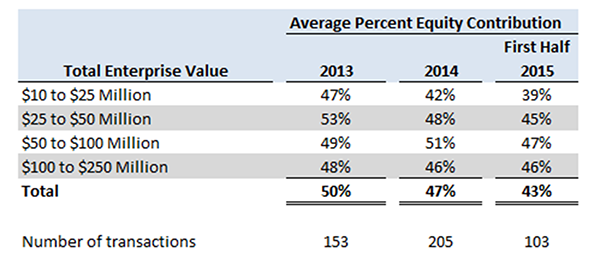
Source: GF Data
Equity contribution has declined the least in the two larger brackets, notwithstanding the fact that debt support on these transactions is greater than on the smaller deals. This is evidence of the more intense competition for quality businesses with $7 to $8 million of EBITDA and up. Buyers of smaller businesses have been able to maintain greater restraint in pricing.
The chart shows the relative movement in pricing since 2013:
Average Multiples 2013 to 2015 (First Half)
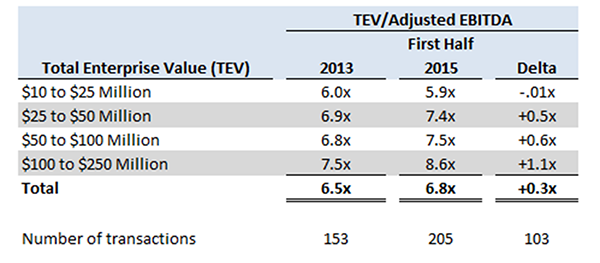
Source: GF Data
In other words, deal values are being sustained at the current frothy levels by debt availability and the larger the beer, the more froth in the mug.
It seems clear that a tightening in available leverage will have an immediate effect on deal pricing, particularly on the $50 million plus transactions where debt support has played an outsized part in the run up in value.
Has this retrenchment started to occur? It isn’t in our data. Debt levels in 2015 2Q were at an all-time high in a sample that goes back to 2003. Our subscribers and other market participants tell us they’re seeing no sign of it either, that even in processes where they think a new line is being drawn, a willing lender always emerges.
The last downturn is of limited utility in trying to gauge the timing and the shape of the next one. By the time of the collapse of the mortgage finance market in mid-2007, average equity contribution had been declining about four percentage points from a high of 46% in 2005. However, as the global economic meltdown hit private M&A equity with full force in 2008, there was a massive flight to quality — deal volume fell off the table, but average multiples fell only slightly, from 6.3x in 2007 to 6.1x in 2008.
The chart below (click on the chart to enlarge it) indicates an even more salient point. Average equity share did not crack 50 percent in the years heading into the financial downturn. It got there in the still-frigid days of 2009, as the deals that were getting done tended to be conservatively capitalized, and stayed in the 50 percent range for the next few years as the market heated up.
Equity and Debt Contributions 2003 to 2015 (First Half)
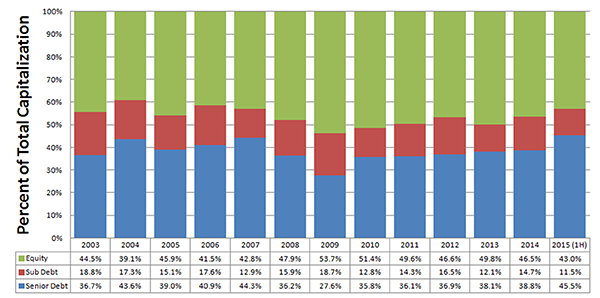
Source: GF Data
This lends support to our thinking that once debt markets cool off a bit, sponsors are more likely to exert some discipline on valuation than return to a historically aberrant percentage of equity share.
We note as well that the larger middle-market businesses whose size enables them to attract leverage are for the same reason more likely to energize strategic as well as financial buyers. Here the recent market tumult does come in to play. At some point, public companies looking to their own stock valuation as a benchmark become less formidable bidders.
Given the continuing intensity of competition for attractive businesses approaching or above $10 million of EBITDA, our guess is that the immediate effect is a pendulum swing in favor of financial buyers rather than an across-the-board decline in valuations.
In sum, we aren’t prepared to say the market has crested, but are prepared to say that dynamics driving the crest are there now for us to see.
(c) 2015 PEPD * Private Equity’s Leading News Magazine * 9-25-15
“GF Data is one of the only data sources that can provide our clients with valuation data specific to the size of their business from the perspective of financial buyers.”
—Jeremy Ellis, Genesis Capital
“GF Data reports on what financial buyers are really paying for middle market companies. They also provide valuable data on leverage, pricing, and terms and conditions. There is no other reliable source for this type of data.”
—Ronald Miller, President and Managing Director, Cleary Gull Inc.
“As the leading underwriter of public capital in the BDC sector, we rely on GF Data to give us a competitive edge and keep us current on leverage and valuation levels.”
—Joe Culley, Head of Capital Markets, Janney Montgomery Scott
Contact Info:
GF Data Resources LLC
2176 Harts Lane
Conshohocken, PA 19428
610-616-4607
info@gfdata.com
News
Registered Subscribers
Subscription Renewal
New Subscription Request